![]() Figure 1 of
Popp, Mol Vis 2007;
13:164-173.
Figure 1 of
Popp, Mol Vis 2007;
13:164-173.
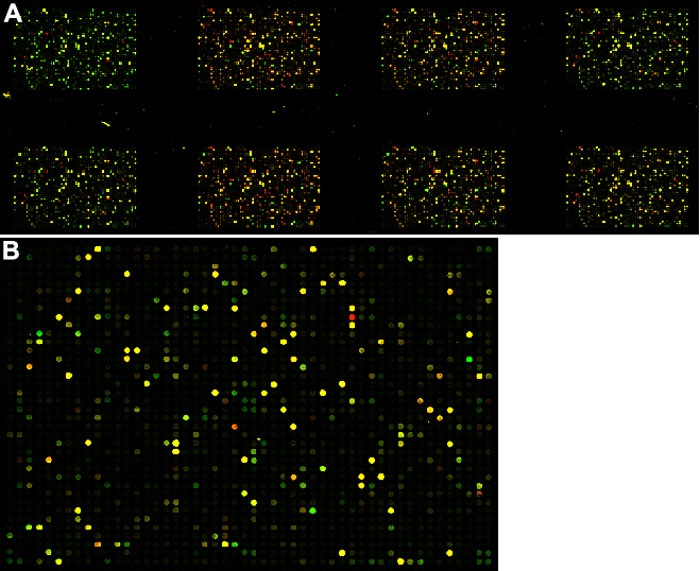
Figure 1. Examples of images generated from scanned microarrays
Example of an image generated from a scanned eight-pack microarray (A) and a single 1,900 element (B) microarray. Each circle represents a unique spotted probe. Red probes indicate that gene expression in the surgically treated eye is higher than in the control, while green marks higher gene expression in the control. Yellow indicates no difference in gene expression between the surgically treated and control eyes. Black denotes absence of detectable signal.