![]() Figure 4 of
Guleria, Mol Vis 2007;
13:1657-1665.
Figure 4 of
Guleria, Mol Vis 2007;
13:1657-1665.
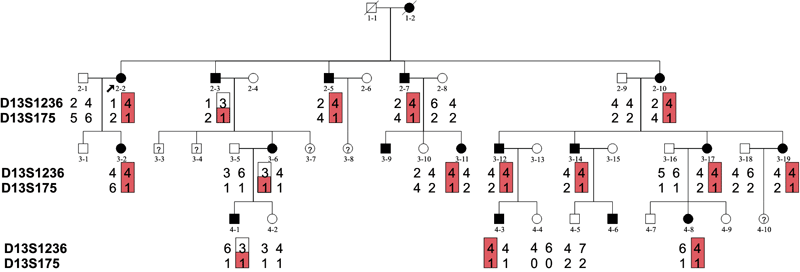
Figure 4. Haplotype analysis of the cataract family
Haplotypes segregating with the disease are indicated in the shaded boxes. Recombination events were observed in three affected individuals (2-3, 3-6, and 4-1) at D13S1236. Squares and circles symbolize males and females, respectively and filled symbols denote affected individuals. Proband (2-2) is indicated with a black arrow.
