![]() Figure 3 of
Guleria, Mol Vis 2007;
13:1657-1665.
Figure 3 of
Guleria, Mol Vis 2007;
13:1657-1665.
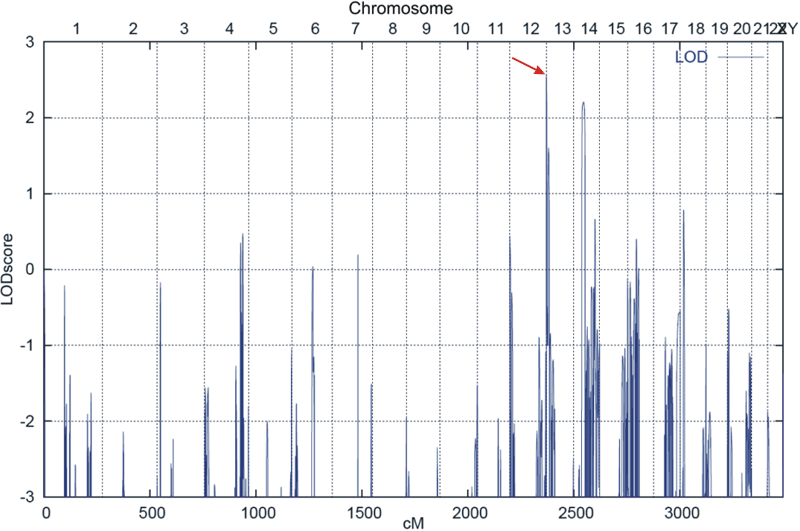
Figure 3. Graphical view of additive LOD score calculations of genome-wide single nucleotide polymorphism
The highest peak on chromosome 13 (indicated by red arrow) with lod score value of 2.56 indicates the region of potential linkage.
