![]() Figure 3 of
Gu, Mol Vis 2007;
13:1651-1656.
Figure 3 of
Gu, Mol Vis 2007;
13:1651-1656.
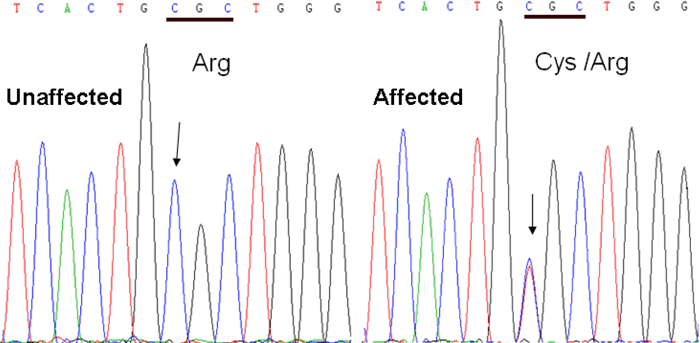
Figure 3. DNA sequence chromatograms
DNA sequence chromatograms are shown of the unaffected members (left) and affected members (right) in an autosomal dominant total cataract family. A single transition was observed at position 97 (C>T).
