![]() Figure 1 of
Gu, Mol Vis 2007;
13:1651-1656.
Figure 1 of
Gu, Mol Vis 2007;
13:1651-1656.
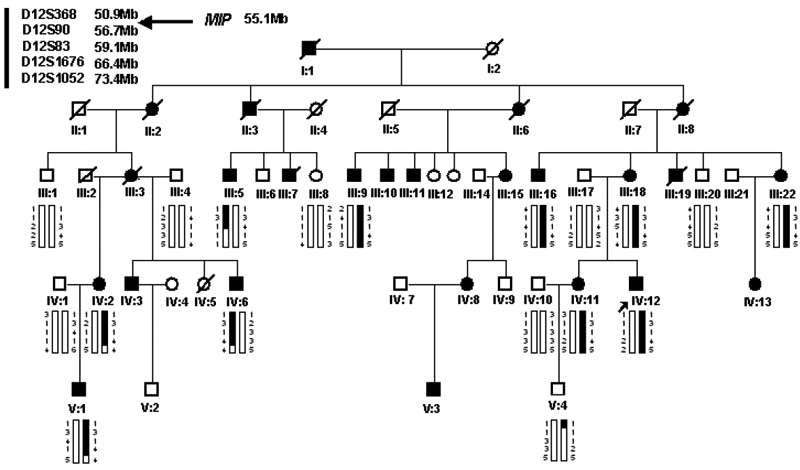
Figure 1. Cataract pedigree and haplotype analysis
Pedigree and haplotype analysis of the cataract family shows the segregation of five microsatellite markers on chromosome 12q13.1-21.1, listed in descending order from the centromeric end. Black circles (females) and black squares (males) represent affected individuals with cataract. The physical distance of the short tandem repeat (STR) and disease gene have been given. Unaffected individuals are not shaded. Black lines denote deceased. An individual is identified by generation number and the numbers below the symbols. Individuals III:5 and V:4 appear to be recombinants and the disease gene was mapped between a 15.5 Mb interval bound by D12S368 and D12S1676.
