![]() Figure 3 of
Ayala-Lugo, Mol Vis 2007;
13:151-163.
Figure 3 of
Ayala-Lugo, Mol Vis 2007;
13:151-163.
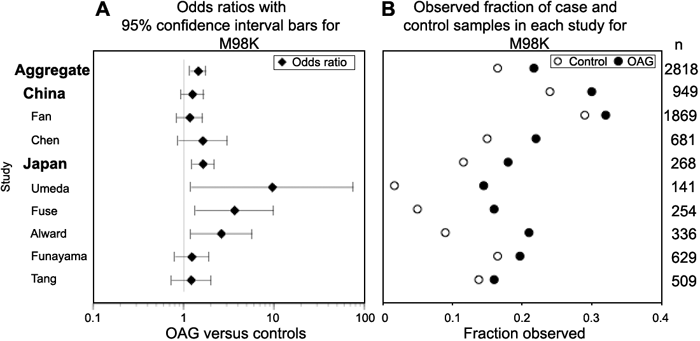
Figure 3. Studywise differences appear in Japanese populations when odds ratios and frequencies of M98K mutations are compared
The left-hand graph (A) shows the odds ratios with 95% confidence interval bars for individual Asian studies and pooled results for Japan, China, and both in open angle glaucoma (OAG) cases versus controls. Odds ratios and confidence intervals are fixed effect estimates resulting from the Mantel-Haenszel method. The right-hand graph (B) shows the case (OAG, filled circle) and control (open circle) proportions observed for each study. Total sample sizes are listed along the right-hand margin. Larger samples have both narrower confidence intervals and shorter distance between fractions observed for cases and controls. Studies inconsistently estimate the odds of OAG versus controls carrying an M98K mutation, with larger studies (more than 400 total cases and controls) estimating no statistically significant difference. Other population estimates are not shown, because, among the European population-based studies, only Rezaie's study [9] showed a statistically significant difference. The single study on India yielded a significant odds ratio, but no other comparable populations have been reported [19].
