![]() Figure 2 of
Soest, Mol Vis 2007;
13:1608-1617.
Figure 2 of
Soest, Mol Vis 2007;
13:1608-1617.
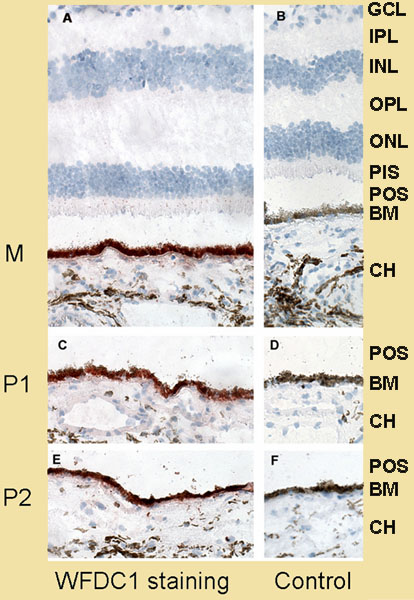
Figure 2. Immunoreactivity pattern of WFDC1 in three regions of a healthy retina
The optimal dilution of the antibody (1:25) was determined through titration from the originally used 1:4 dilution [14]. Dilutions higher than 1:100 did not stain well on retinal pigment epithelium (RPE). We show staining in the RPE near the macula (M; with A. B is a negative control), the paramacular area (P1; with C. D is a negative control) and the mid-postequatorial periphery. (P2; with E. F is a negative control). In the RPE specific staining, the intensity of the red color is highest in region M. Semi-quantitative optical density measurements of the RPE, corrected for absorption by melanin (brown color, see negative controls B, D, and F), show a twofold higher staining intensity in the macula compared to the P2 periphery. The following abbreviations were used: ganglion cell layer (GCL), inner plexiform layer (IPL), outer plexiform layer (OPL), outer nuclear layer (ONL), photoreceptor inner segments (PIS), photoreceptor outer segments (POS), Bruch's membrane (BM), and choroid (CH).