![]() Figure 8 of
Bai, Mol Vis 2007;
13:1589-1600.
Figure 8 of
Bai, Mol Vis 2007;
13:1589-1600.
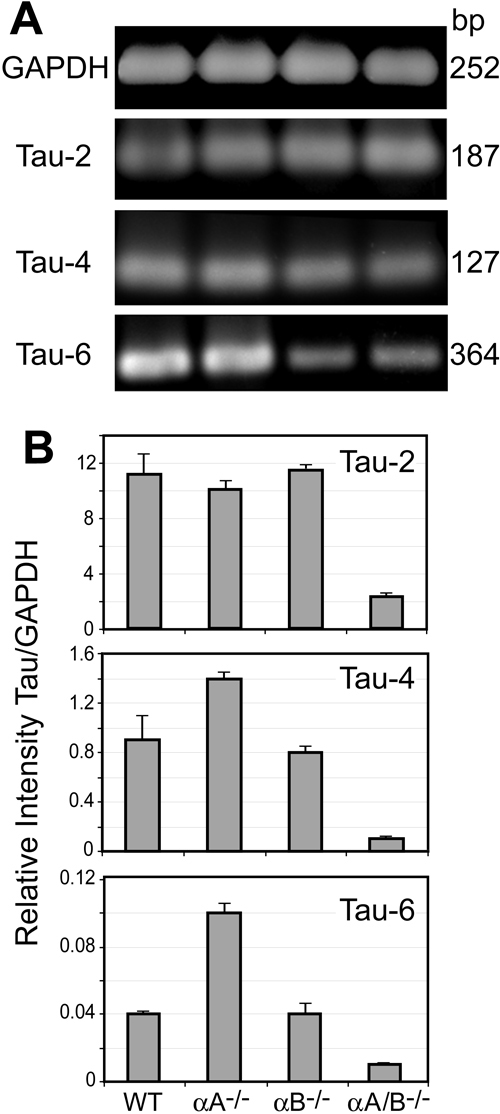
Figure 8. Quantitative RT-PCR analysis for tau transcripts in the brain
A: Transcripts for GAPDH, Tau-2, Tau-4, and Tau-6 were amplified from wild type, αA-/--, αB-/--, and αA/B-/-- lenses. B: Quantitative RT-PCR analysis was performed. Data are representative of three independent experiments.