![]() Figure 3 of
Frost, Mol Vis 2007;
13:1580-1588.
Figure 3 of
Frost, Mol Vis 2007;
13:1580-1588.
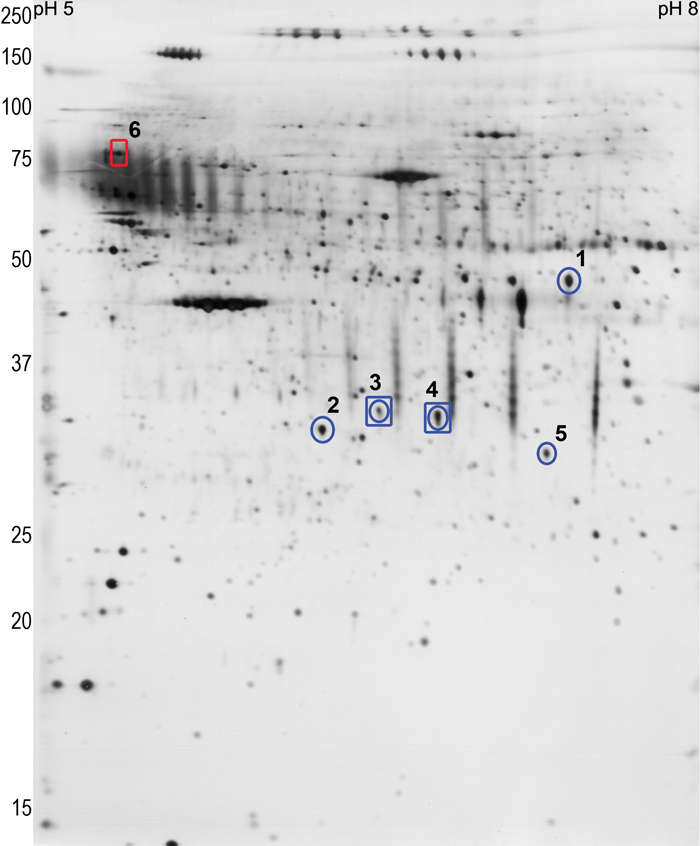
Figure 3. Representative scleral protein profile
An example silver stained two-dimensional gel within the pH 5-8 (pI) and 15-250 kDa (MW) range to show the location of the protein spots found to change. Blue circles indicate the five proteins that were significantly downregulated in the treated eye of all five pairs of eyes. During recovery, two of these spots were still downregulated (blue squares) and an additional spot was upregulated (red square).