![]() Figure 2 of
Frost, Mol Vis 2007;
13:1580-1588.
Figure 2 of
Frost, Mol Vis 2007;
13:1580-1588.
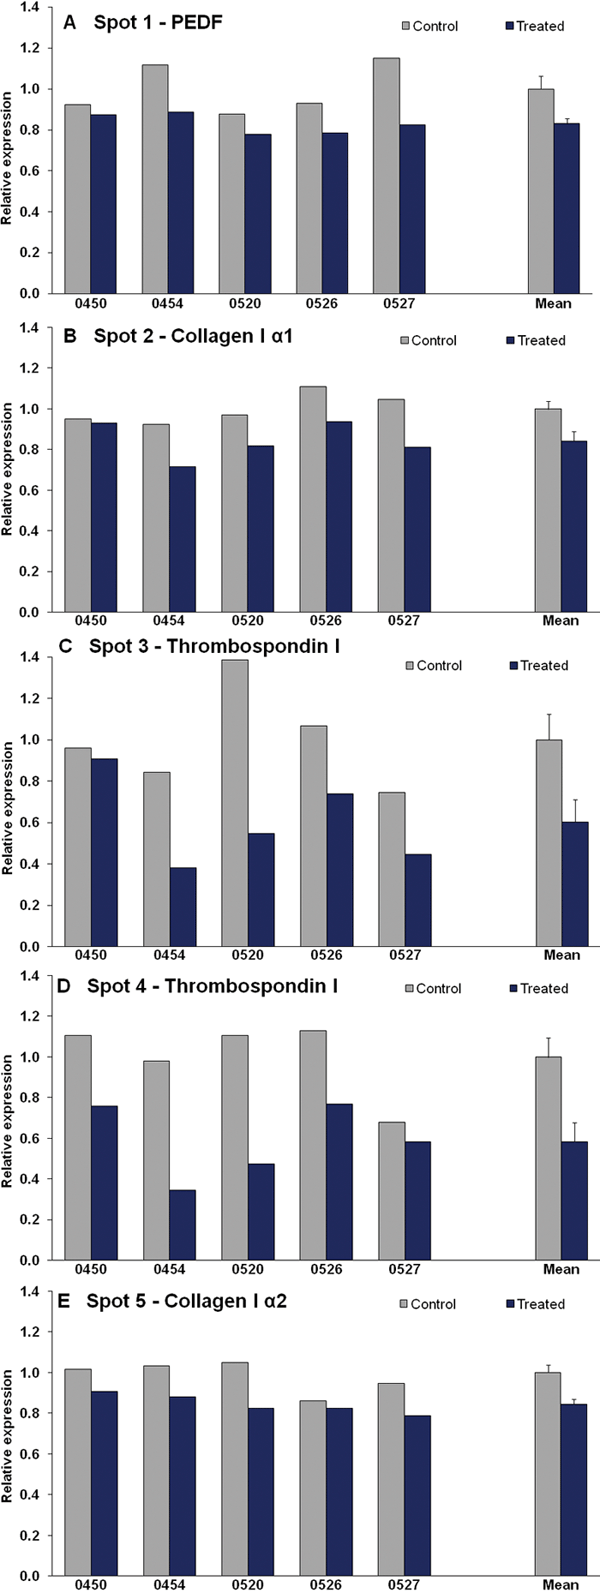
Figure 2. Changes in protein expression during the development of lens-induced myopia
Relative expression values of each differentially expressed spot for treated and control eyes for each animal and the group mean (±SEM), normalized to the mean control expression level. All of the differentially expressed proteins were downregulated in the treated eye compared to the control eye.
