![]() Figure 4 of
Joachim, Mol Vis 2007;
13:1573-1579.
Figure 4 of
Joachim, Mol Vis 2007;
13:1573-1579.
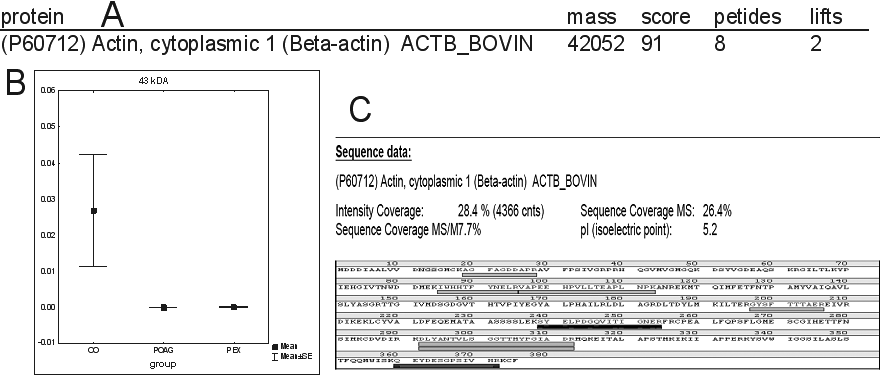
Figure 4. The antigen at 43 kDa was identified as actin
There was a significant difference at this molecular weight region between the three groups (p=0.0099). Both glaucoma groups were down-regulated in comparison to the control group.
