![]() Figure 2 of
Joachim, Mol Vis 2007;
13:1573-1579.
Figure 2 of
Joachim, Mol Vis 2007;
13:1573-1579.
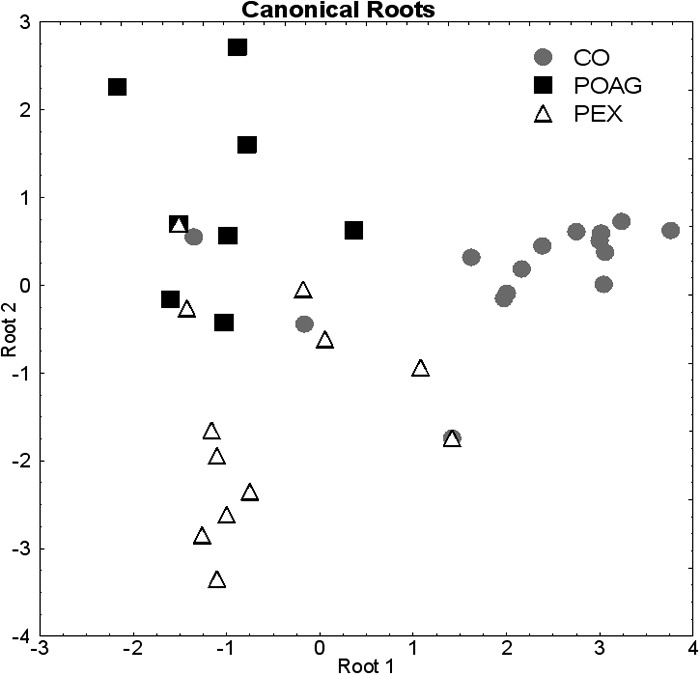
Figure 2. Canonical roots of patients with primary open angle glaucoma, of patients with pseudoexfoliation glaucoma, and of controls
These canonical roots were derived from discriminant analysis and were plotted for each patient. This two-dimensional graph shows the similarity of the three patient groups. The closer the points are to each other, the more similar the antibody patterns were on the western blots of these patients.
