![]() Table 2 of
Martins, Mol Vis 2007;
13:142-150.
Table 2 of
Martins, Mol Vis 2007;
13:142-150.
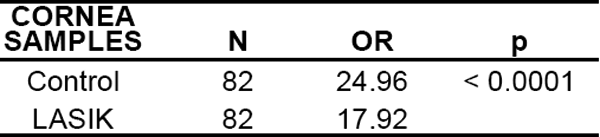
Table 2. Optical retardation mean values for control cornea and cornea submitted to LASIK, embedded in water
Statistical significance was calculated by analysis of variance between groups (ANOVA), as described in the text. Eighty-two measurements were performed for each corneal group (Control and LASIK) in different regions of corneal slices. In the table, "N" indicates the number of measurements for each group, "OR" indicates the optical retardation value, and "p" denotes the significance level.