![]() Figure 5 of
Wilkinson-Berka, Mol Vis 2007;
13:1529-1538.
Figure 5 of
Wilkinson-Berka, Mol Vis 2007;
13:1529-1538.
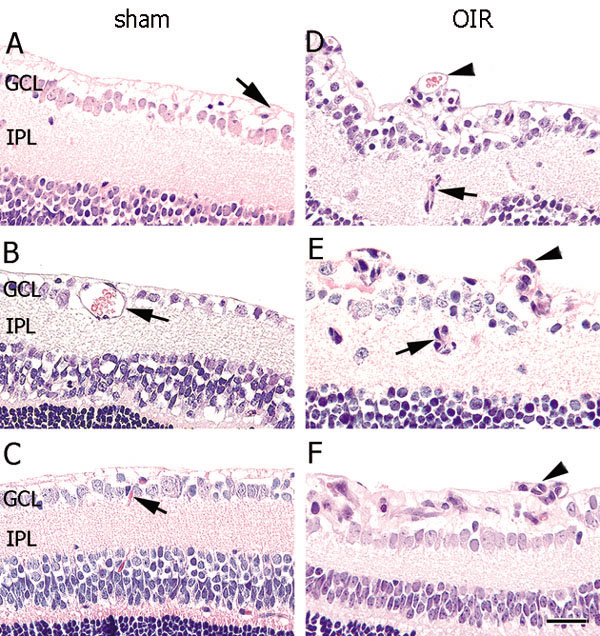
Figure 5. Three μm paraffin sections and quantitation of blood vessel profiles in the inner retina from mice with oxygen induced retinopathy and treated with the control oligonucleotide ATL 260120 using an early intervention protocol
At a dose of 20 mg/kg, ATL 260120 reduced pathological angiogenesis in mice with oxygen induced retinopathy, but had no effect on physiological angiogenesis in sham mice. The following abbreviations are used: oxygen induced retinopathy (OIR); ganglion cell layer (GCL); inner plexiform layer (IPL) and blood vessel profiles (BVPs). The sections are stained with hematoxylin and eosin. Magnification x150. Scale bar equals 50 μm. A is sham+vehicle, B is sham+20 mg/kg ATL 260120, C is sham+30 mg/kg ATL 260120, D is OIR+vehicle, E is OIR+20 mg/kg ATL 260120, and F is OIR+30 mg/kg ATL 260120. In all shams, BVPs (arrows) were evident in the GCL and IPL. In OIR+vehicle (D), numerous BVPs (arrows) were in the inner retina and adherent to the retinal surface (arrowhead). Retina from OIR+20 mg/kg ATL 260120 (E) appeared similar to OIR+vehicle (D). Retina from OIR+30 mg/kg ATL 260120 (F) had fewer BVPs (arrows) in the inner retina than OIR+vehicle (D), however BVPs occasionally penetrated into the vitreous (arrowhead). G: Values are mean±sem. N=7 to 9 mice per group. Asterisk denotes p<0.0001 compared to all OIR groups. Cross denotes p<0.005 compared to OIR+vehicle.