![]() Figure 3 of
Cristofanilli, Mol Vis 2007;
13:1496-1507.
Figure 3 of
Cristofanilli, Mol Vis 2007;
13:1496-1507.
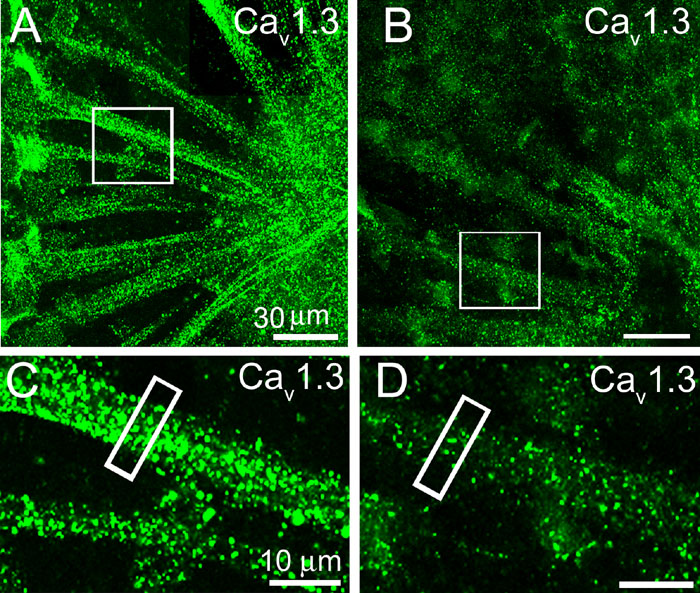
Figure 3. Effect of latrunculin A on Cav1.3 channel localization in ganglion cell axons
A: Confocal images of ganglion cell axons in retinal whole-mounts show dense concentration of Cav1.3 immunoreactive puncta along the axons in control retinas. B: Disruption of F-actin with latA reduced Cav1.3 labeling in axons. C, D: Magnified images of areas indicated in A and B show a significant reduction in Cav1.3 puncta on latA-treated ganglion cell axons. E: The bar graph summarizes the effect of F-actin disruption on intensity of Cav1.3 immunofluorescence in control and latA-treated retinas. F: Intensity profiles of Cav1.3 immunofluorescence from indicated areas in C and D.