![]() Figure 2 of
Cristofanilli, Mol Vis 2007;
13:1496-1507.
Figure 2 of
Cristofanilli, Mol Vis 2007;
13:1496-1507.
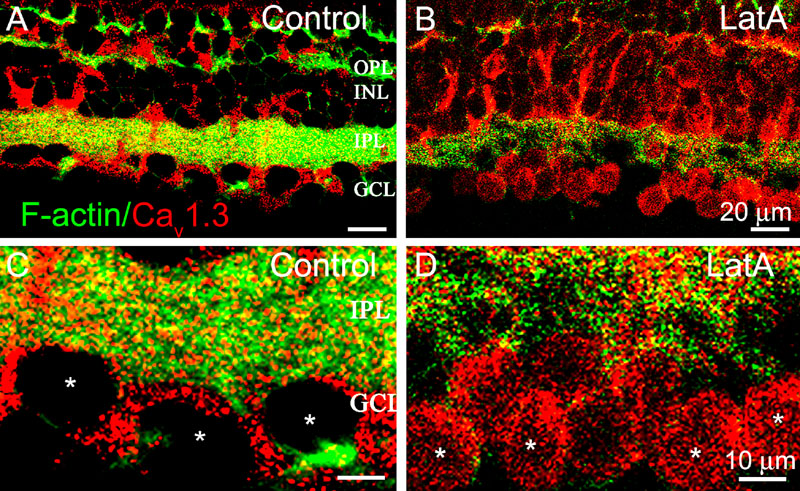
Figure 2. Effect of latrunculin A on distribution of Cav1.3 channels in retinal slices
A: Distribution of Cav1.3 channels in control slices. Vertical sections are double labeled with anti-Cav1.3 antibody (red) and Alexa-Fluor488-phalloidin (green) to visualize F-actin. B: Pretreatment of slices for 30 min with 5 μM latA reduced intensity of phalloidin staining, indicative of F-actin disruption, and increased Cav1.3 labeling in the cell cytoplasm. C, D: Magnified images of ganglion cell layer (GCL) in control, and latA-treated retinal slices show increased Cav1.3 labeling in cell cytoplasm (asterisks), following F-actin disruption.