![]() Figure 4 of
Sengupta, Mol Vis 2007;
13:1406-1411.
Figure 4 of
Sengupta, Mol Vis 2007;
13:1406-1411.
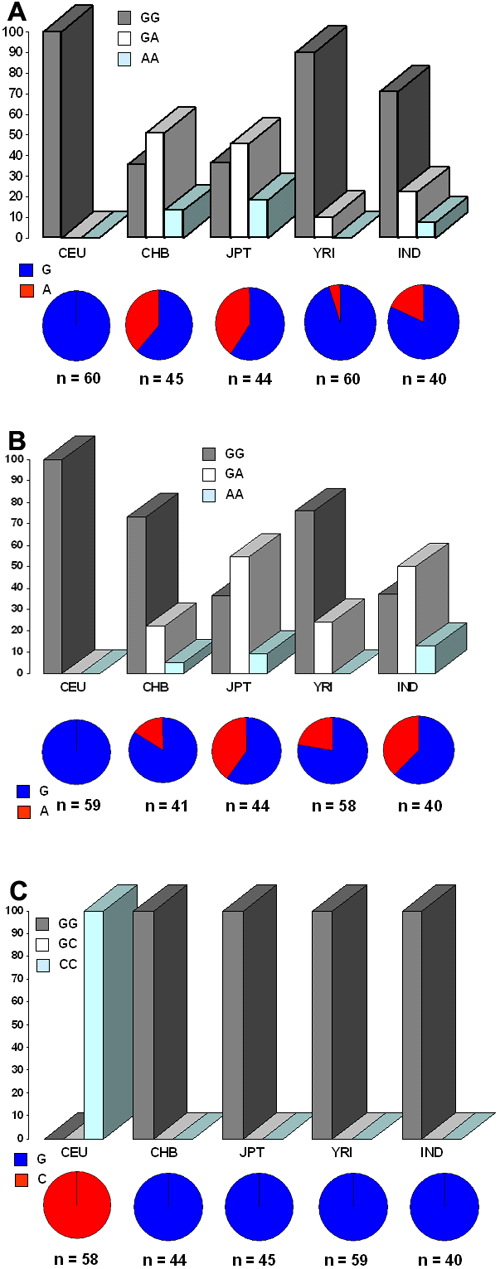
Figure 4. Comparison of three coding single nucleotide polymorphisms (Glu272Lys, Thr329Thr, and Leu374Phe) in SLC45A2 between Indian and other population groups
In each panel, the bar diagram shows the genotype frequencies while the pie chart shows the allele frequencies. For Glu272Lys (A), IND differed in genotype frequency from the rest of the populations. For Thr329Thr (B), the genotype frequency of IND was found to be similar to the JPT population whereas in the case of Leu374Phe (C), IND matches the rest of the world populations except CEU. CEU, Utah residents with ancestry from northern and western Europe collected by CEPH (Centre d'Etude du Polymorphisme Humain); CHB, Han Chinese in Beijing, China; JPT, Japanese in Tokyo, Japan; YRI, Yoruba in Ibadan, Nigeria; and IND, India.
