![]() Figure 4 of
Liskova, Mol Vis 2007;
13:1339-1347.
Figure 4 of
Liskova, Mol Vis 2007;
13:1339-1347.
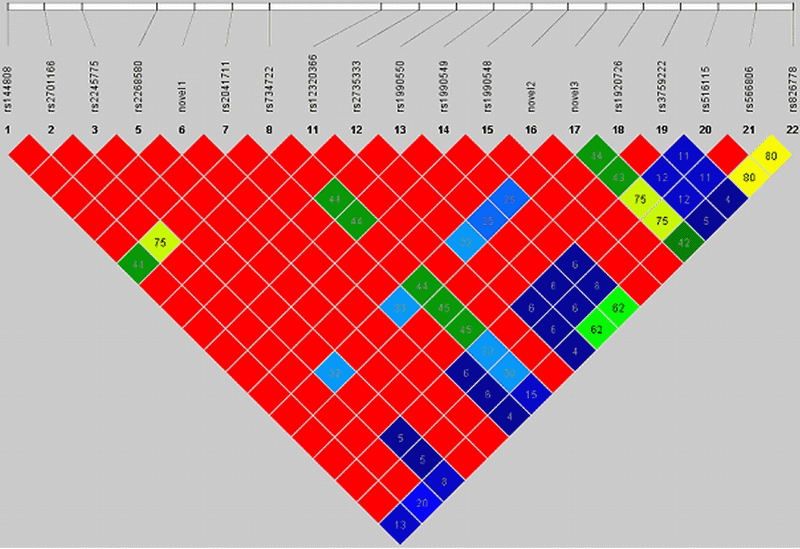
Figure 4. Heatmap plot of linkage disequilibrium (LD) over the KERA gene and surrounding genome in the control study panel
Graphical representation of the linkage disequilibrium (LD) over the KERA gene and flanking region in the control panel is shown. The color filling of the cells represents the pairwise LD measured as D'. The bright-red color of the cells is indicative of the high LD, while the dark-blue colors represent the least LD. Numbers inside the cells, when present, show the exact value of D' if it is not 1. Uninformative polymorphisms were not included.
