![]() Figure 4 of
Suryanarayana, Mol Vis 2007;
13:1291-1297.
Figure 4 of
Suryanarayana, Mol Vis 2007;
13:1291-1297.
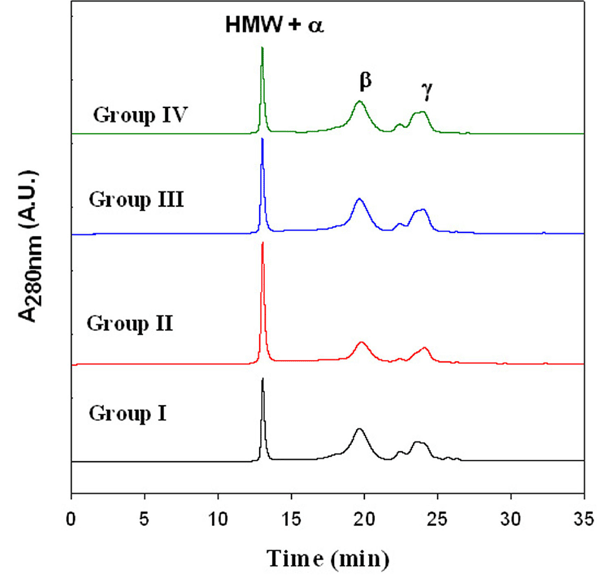
Figure 4. The distribution profile of crystallins in the soluble fraction of lens
The distribution profile of crystallins in the soluble fraction of lens of different groups was monitored by size exclusion chromatography (SEC). Soluble protein (20 μl of a 1 mg/ml dilution in equilibration buffer) was loaded on TSK-G 2000 SW SEC column and protein peaks were detected at 280 nm with a flow rate of 1 ml/min. Peaks representing α-, β-, and γ-crystallins and high molecular weight (HMW) fractions are indicated at their respective positions.