![]() Figure 3 of
Vasiliev, Mol Vis 2007;
13:114-124.
Figure 3 of
Vasiliev, Mol Vis 2007;
13:114-124.
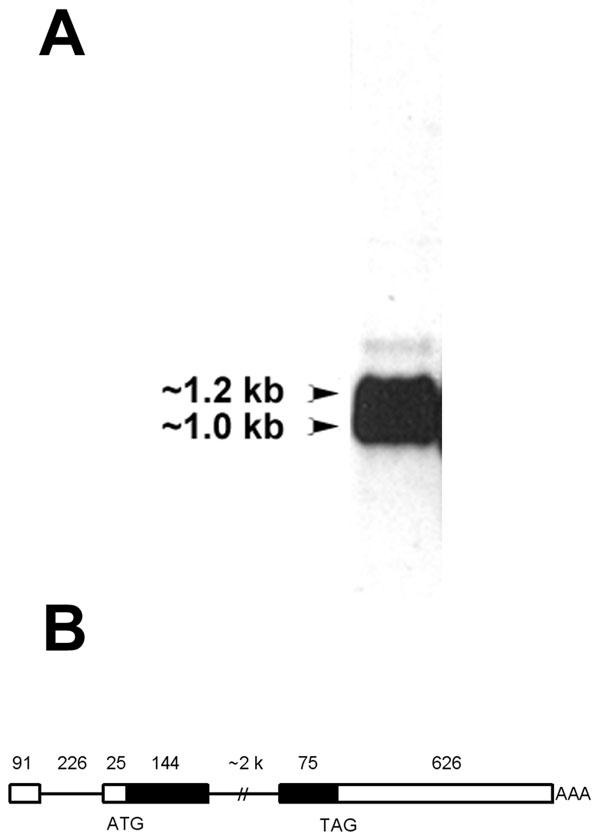
Figure 3. Splicing of Hop transcripts in the lens
A: Northern blot of total RNA extracted from E15-E16 lens fiber masses and probed with a digoxigenin-labeled Hop riboprobe. Two bands were detected that were the approximate predicted size of the Hop mRNA, with or without the inclusion of the first intron. B: Diagram showing the chicken Hop gene structure. The dimensions of the different regions of the gene are not to scale. The numerals above the line diagram mark the number of nucleotide pairs in each region. Introns are represented by thin solid lines and exons by boxes. Filled boxes represent translated regions of the mRNA and unfilled boxes are the untranslated regions.