![]() Figure 6 of
Rizzolo, Mol Vis 2007;
13:1259-1273.
Figure 6 of
Rizzolo, Mol Vis 2007;
13:1259-1273.
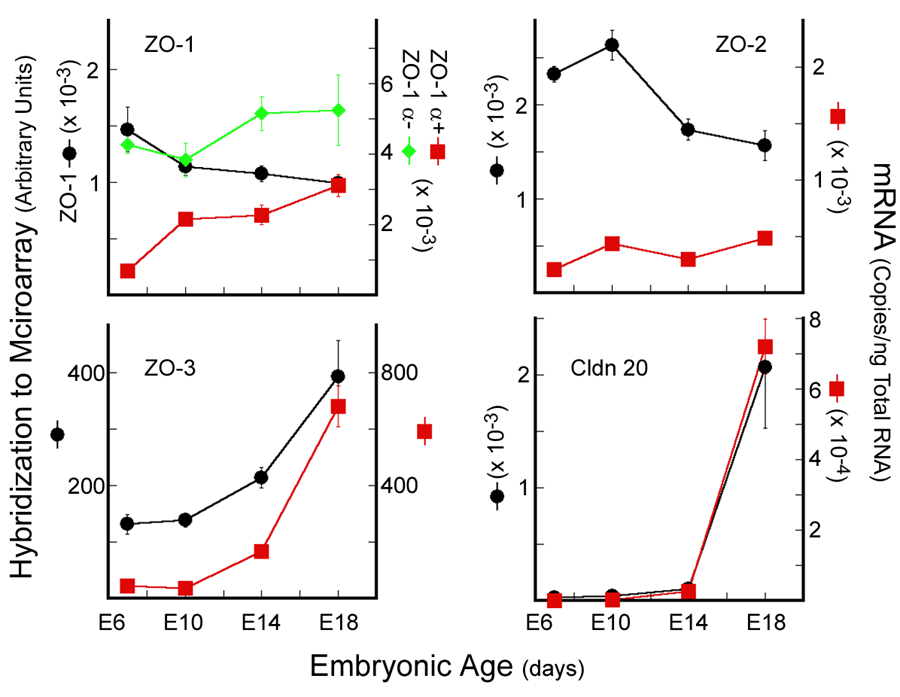
Figure 6. Correspondence of hybridization to the microarray and quantitative polymerase chain reaction of ZO and claudin 20 mRNAs
The hybridization data are represented by black circles. For ZO-1, the hybridization data measure total ZO-1 mRNA, whereas the polymerase chain reaction (PCR) data are specific for ZO-1α+ (red squares) or ZO-1α- (green diamonds). For ZO-2, ZO-3, and claudin 20, the PCR data are represented by red squares. Qualitatively, both methods revealed the same pattern and relative level of expression. The data for ZO-1 indicates that the splicing of its hnRNA was developmentally regulated. Hybridization to microarray, left y-axis; Quantitative PCR, right y-axis.
