![]() Figure 5 of
Rizzolo, Mol Vis 2007;
13:1259-1273.
Figure 5 of
Rizzolo, Mol Vis 2007;
13:1259-1273.
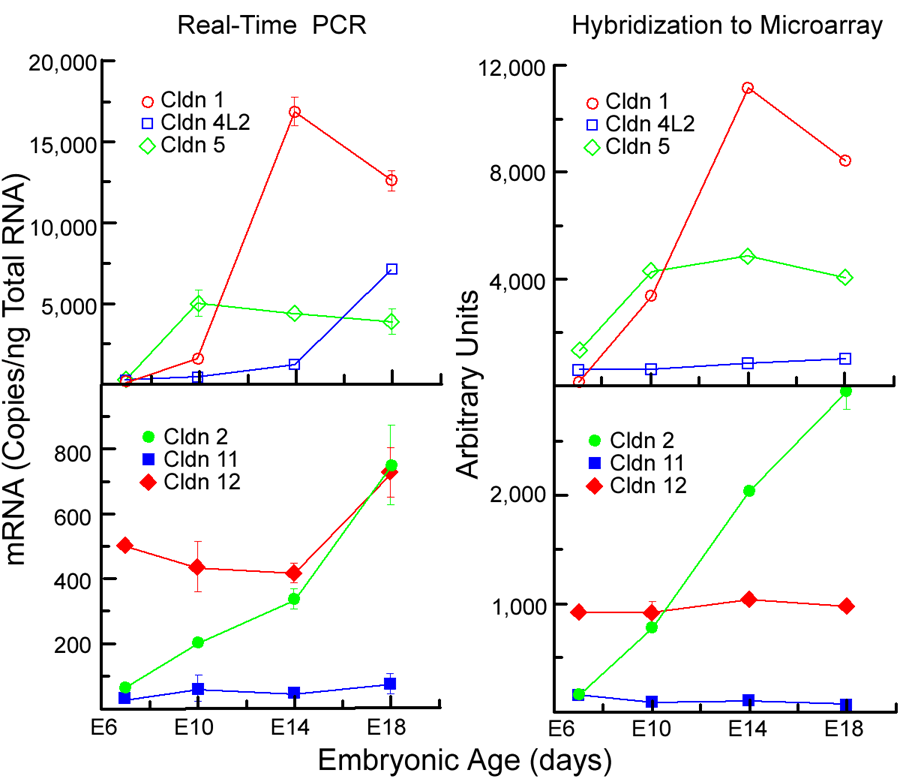
Figure 5. Correspondence of hybridization to the microarray and quantitative polymerase chain reaction of claudin mRNAs
The left panels show PCR data taken from Rahner et al. [16], reproduced with permission. The data for claudin 1 was re-evaluated in this study to address the large error for E18 in the original study. The right panels show the corresponding data from the microarray. The standard error is shown when it exceeded the size of the symbol. Qualitatively, both methods revealed the same pattern and relative level of expression. Quantitatively, hybridization was less sensitive to small changes. The small, but statistically significant, increase in claudin 4L2 that was measured by hybridization was observed to be a 35x increase when measured by PCR.
