![]() Figure 3 of
Konomi, Mol Vis 2007;
13:1251-1258.
Figure 3 of
Konomi, Mol Vis 2007;
13:1251-1258.
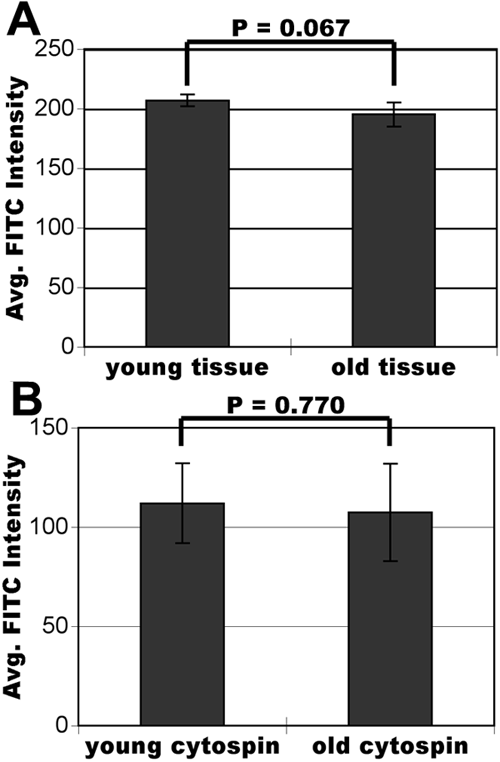
Figure 3. Comparison of average fluorescein isothiocyanate intensity between younger and older donors
For these graphs, the average FITC intensity of HCEC from the center and periphery were added together and the totals were compared between young and older donors. The graph in (A) shows the analysis of HCEC in ex vivo corneas. The graph in (B) illustrates the analysis of HCEC directly isolated from corneal tissue and recovered by cytospin. Bars represent standard deviation.
