![]() Figure 2 of
Konomi, Mol Vis 2007;
13:1251-1258.
Figure 2 of
Konomi, Mol Vis 2007;
13:1251-1258.
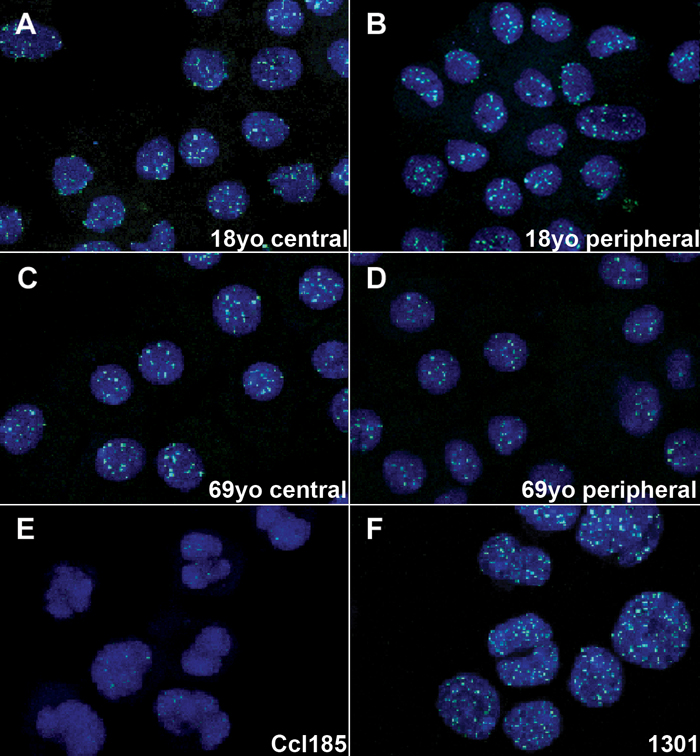
Figure 2. PNA/FITC analysis of telomere lengths in freshly isolated human corneal endothelial cells
Micrographs in A-F are representative Q-FISH digital images of HCEC directly isolated from corneal tissue and recovered by cytospin. A: 18-year-old central area; B: 18-year-old peripheral area; C: 69-year-old central area; D: 69-year-old peripheral area; E: Ccl185 cells; F: 1301 cells. PNA probe/FITC is seen as small green dots within the nuclei (blue). Note that the relative intensity of the PNA probe/FITC in HCEC is brighter than that observed in Ccl185 cells, which have short telomeres but less intense than that seen in 1301 cells, which have long telomeres. Blue color: The Red color of PI was converted to blue for image analysis. Final magnification: x1000. Graph in (G) presents the average FITC intensity of HCEC directly isolated from corneal tissue and recovered by cytospin. The average FITC intensity of at least 100 nuclei from five images per sample was calculated for the central and peripheral area from each age group. Bars represent standard deviation.