![]() Figure 1 of
Konomi, Mol Vis 2007;
13:1251-1258.
Figure 1 of
Konomi, Mol Vis 2007;
13:1251-1258.
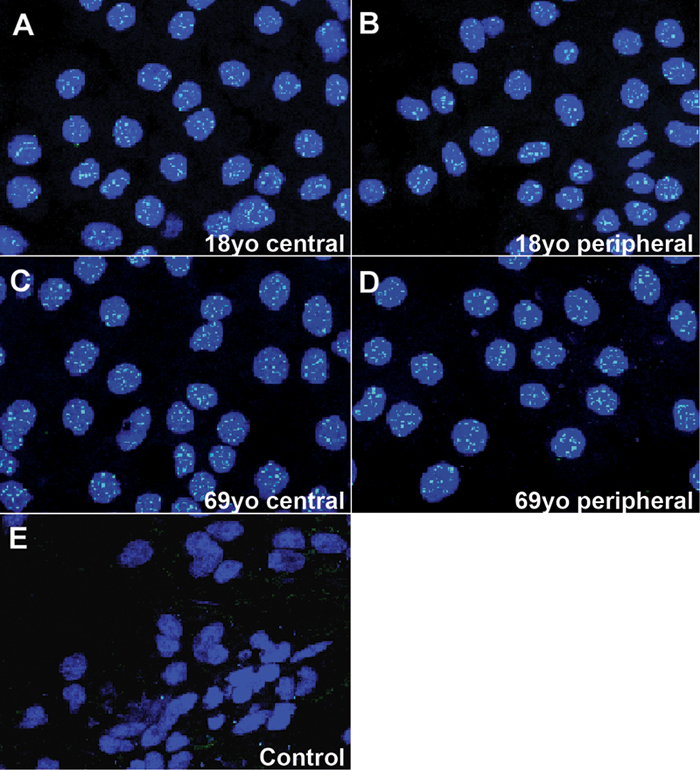
Figure 1. PNA/FITC analysis of telomere lengths in ex vivo human corneal endothelial cells
A-E: Micrographs are representative Q-FISH digital images of HCEC in ex vivo corneas. A: 18-year-old central area; B: 18-year-old peripheral area; C: 69-year-old central area; D: 69-year-old peripheral area; E: Negative control in which corneal quarters were incubated with hybridization solution without a PNA probe. PNA probe/FITC is seen as small green dots within the nuclei (blue). Blue color: Red color of PI was converted to blue for image analysis. Final magnification: x1000. Graph in (F) presents the average FITC intensity of HCEC stained in ex vivo corneas. The average FITC intensity of at least 100 nuclei from five images per sample was calculated for the central and peripheral area of each age group. Bars represent standard deviation.