![]() Figure 2 of
DElia, Mol Vis 2007;
13:1245-1250.
Figure 2 of
DElia, Mol Vis 2007;
13:1245-1250.
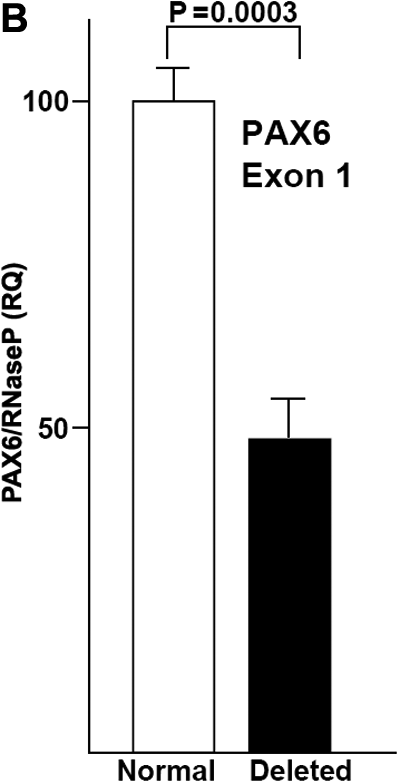
Figure 2. Analysis of deletions in the PAX6 gene region by real-time PCR
(A) Examples of fluorescence amplification plots of the quantitative real-time PCR for exon 1 and 13 of the PAX6 gene. Arrows indicate triplicate signals obtained for a control subject (Normal) and an aniridia patient (Deleted). (B) Quantitative PCR assay to detect PAX6 gene deletions. Results are expressed as the relative quantity (RQ) between PAX6 and RNaseP values. Bars represent mean values ± standard deviations from four normal controls (Normals) and three aniridia patients with known PAX6 gene deletion (Deleted).

