![]() Figure 7 of
Qiong, Mol Vis 2007;
13:1234-1244.
Figure 7 of
Qiong, Mol Vis 2007;
13:1234-1244.
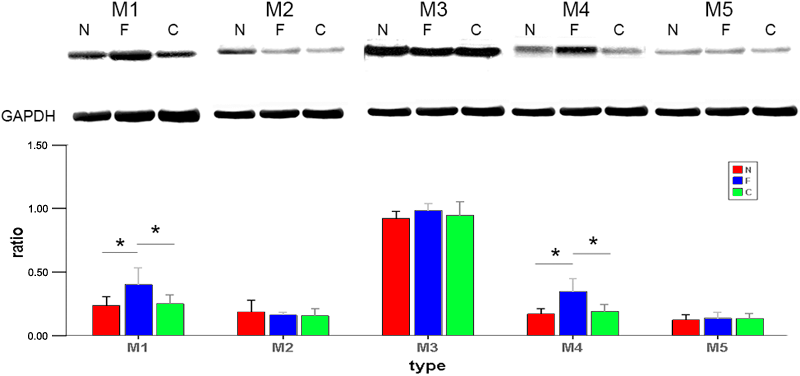
Figure 7. Typical gel indicates the level of glyceraldehyde-3-phosphate dehydrogenase protein relative to those for receptor subtypes M1 to M5
Bar graph shows the change in protein expression in the posterior sclera during form-deprived myopia (F) in guinea pigs. Semiquantitative western blotting showed a significant increase in protein expression for M1 and M4 but not M2, M3, and M5, compared with the internal control (C) and normal (N) eyes. Values (mean±standard error of the mean) were normalized for GAPDH and expressed as ratios of optical density. The asterisk denotes p<0.05.