![]() Figure 5 of
Qiong, Mol Vis 2007;
13:1234-1244.
Figure 5 of
Qiong, Mol Vis 2007;
13:1234-1244.
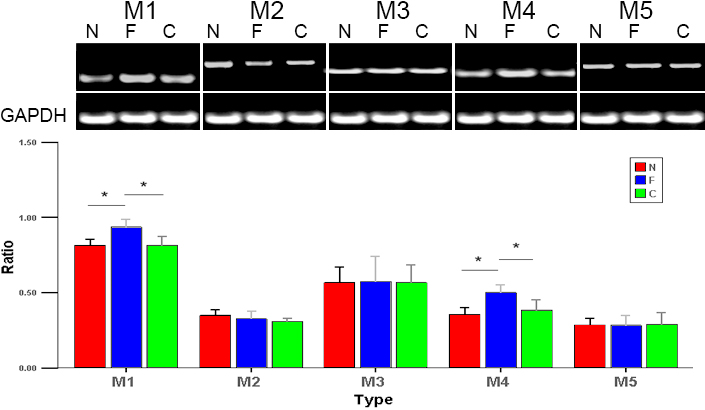
Figure 5. Typical ethidium-bromide agarose gels indicate the level of glyceraldehyde-3-phosphate dehydrogenase message relative to those of the subtypes from total RNA
Bar graph shows changes in mRNA expression of receptor subtypes M1 to M5 in the posterior sclera during form-deprived myopia (F) in guinea pigs. Semiquantitative reverse-transcription polymerase chain reaction showed a significant increase in mRNA expression for M1 and M4 but not for M2, M3, and M5 compared with the internal control (C) and normal (N) eyes. Values (mean±standard error of the mean) were normalized for GAPDH and expressed as ratios of optical density. The asterisk denotes p<0.05.