![]() Figure 3 of
Wang, Mol Vis 2007;
13:1226-1233.
Figure 3 of
Wang, Mol Vis 2007;
13:1226-1233.
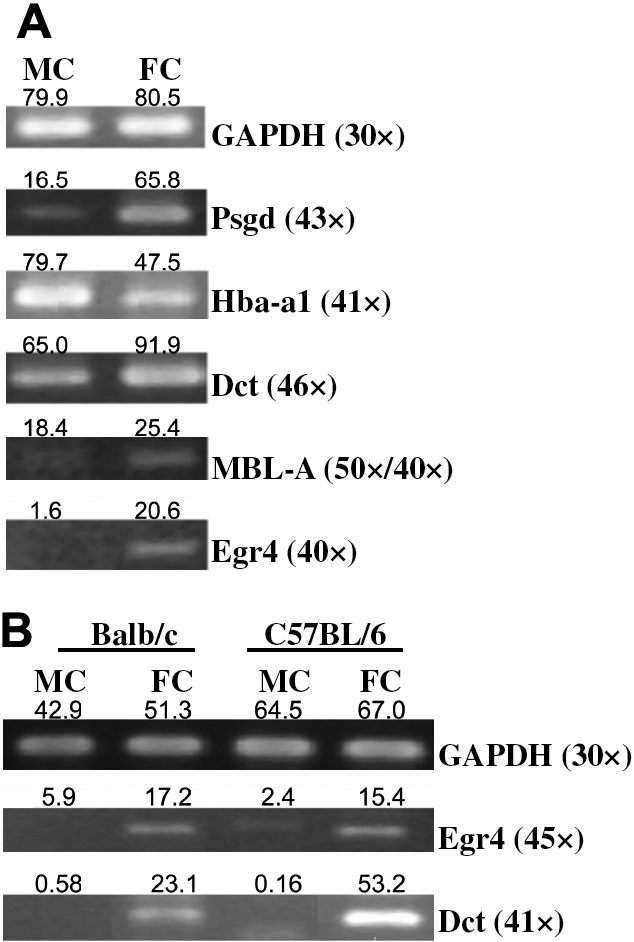
Figure 3. Confirmation of the changes in genes located in heat-killed spore-challenged corneas.
A: This figure shows RT-PCR results obtained with the same batch of RNA samples that were used for microarray. MBL-A was amplified for 50 cycles and the product was diluted 1,000 fold. One μl was subjected for another 40-cycle PCR. B: This figure shows expression changes of Egr4 and Dct in corneas from Balb/c and C57BL/6 strain mice in one representative of two experiments giving similar results. For densitometry analysis, arbitrary illuminant unit obtained with ImageJ was given above each band. MC: control corneas; FC: fungal spore-challenged corneas.