![]() Figure 6 of
Dawes, Mol Vis 2007;
13:1181-1197.
Figure 6 of
Dawes, Mol Vis 2007;
13:1181-1197.
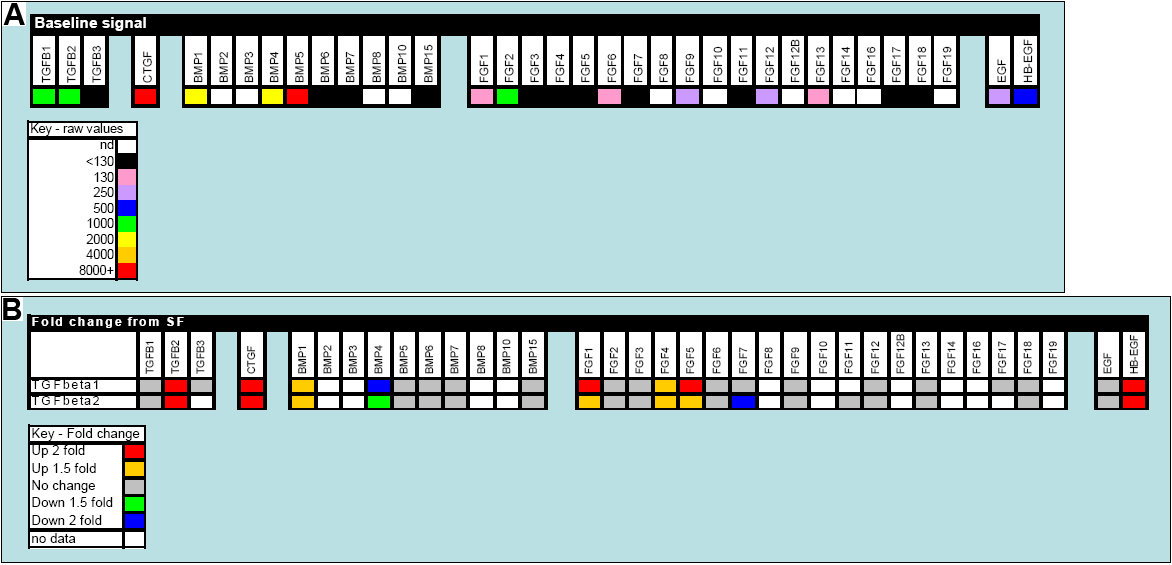
Figure 6. A gene expression profile of selected growth factors in FHL 124 cells
A: The baseline signal of growth factor gene expression detected in non-stimulated serum-free controls using oligonucleotide microarrays. B: Changes detected in gene expression of growth factors following 24 h culture in TGFβ (10 ng/ml) conditions using oligonucleotide microarrays. The data are presented in a colorimetric form to indicate level detected (A) and fold change (B). A key for each is provided.