![]() Figure 4 of
Dawes, Mol Vis 2007;
13:1181-1197.
Figure 4 of
Dawes, Mol Vis 2007;
13:1181-1197.
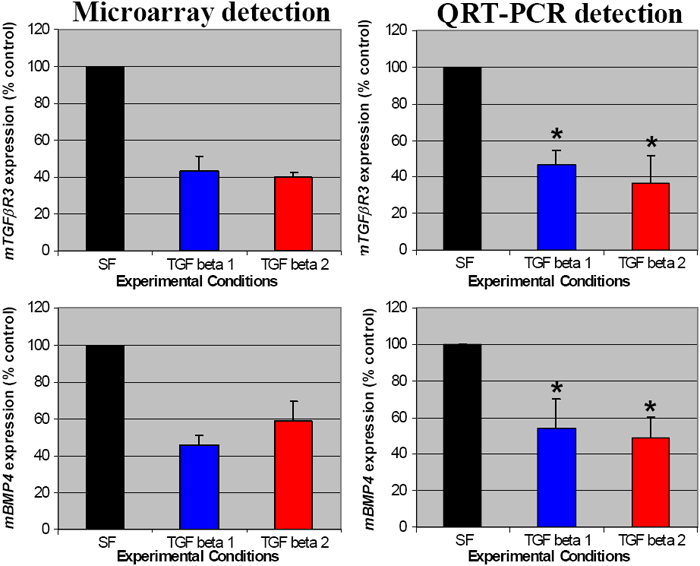
Figure 4. Validation of oligonucleotide microarray detected changes in TGFβR3 and BMP4 gene expression in FHL 124 cells following treatment with TGFβ
Data are derived from the mean value of four separate experiments ±SEM. The asterisk indicates a significant difference between treated and untreated groups (p=0.05, 1 tailed t-test, used for QRT-PCR only). It should be noted that in conjunction with standard protocols for oligonucleotide microarray analysis, studies of expression are on a global basis and therefore, statistical comparison of individual genes is not presented. However, error bars are shown to provide an indication of variation.
