![]() Figure 3 of
Liang, Mol Vis 2007;
13:1169-1180.
Figure 3 of
Liang, Mol Vis 2007;
13:1169-1180.
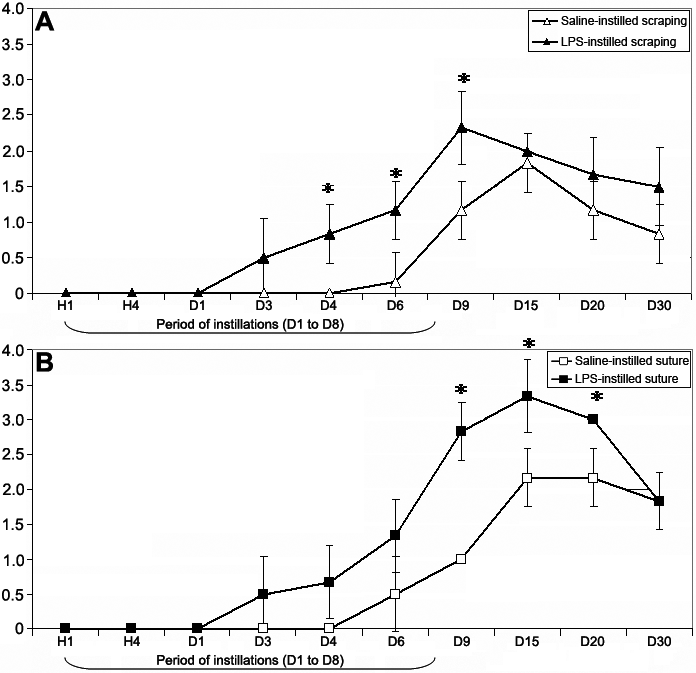
Figure 3. Mean neovascularization scores in the saline- or LPS-instilled scraping and suture models
This figure shows the mean neovascularization scores in the saline- or LPS-instilled scraping (A) and suture (B) models. The two incision models did not induce neovascularization. The asterisk indicates that p<0.05 compared to the corresponding saline-instilled models.
