![]() Figure 3 of
Lu, Mol Vis 2007;
13:1154-1160.
Figure 3 of
Lu, Mol Vis 2007;
13:1154-1160.
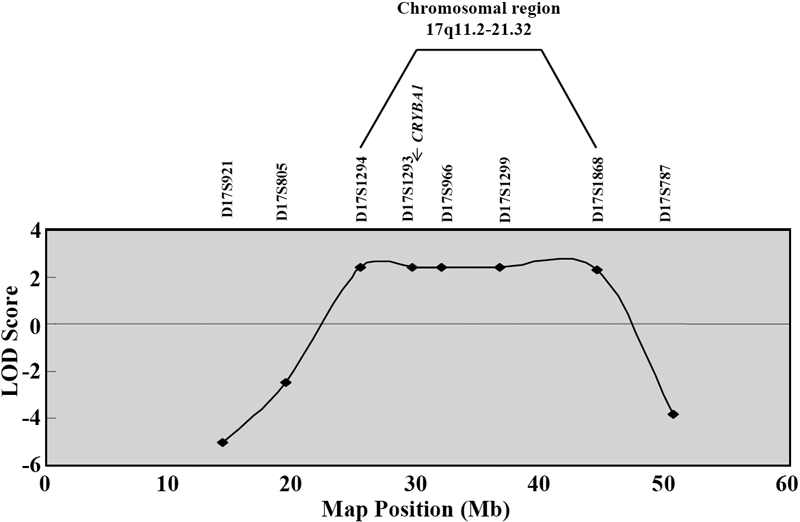
Figure 3. Results from multi-point linkage analyses assigning the autosomal dominant congenital cataract predisposition to chromosomal region 17q11.2-21.32 in Family 1
The graph illustrates LOD scores obtained for the nine typed microsatellite markers. Six markers from the interval D17S1294-D17S1866, which includes the candidate gene CRYBA1, show positive LOD scores above 2.