![]() Figure 6 of
Beattie, Mol Vis 2007;
13:1106-1113.
Figure 6 of
Beattie, Mol Vis 2007;
13:1106-1113.
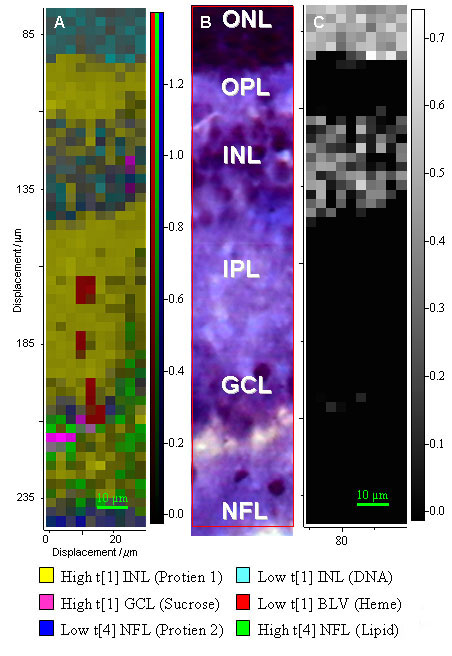
Figure 6. Comparison of Raman data with histological section
A: Raman map of the distribution of major spectral components in the inner segments of the area centralis of porcine retina. Principal component analysis was used to create reference spectra for linear combination of elements (LCE) analysis of the spectral data. Six major spectral contributors were selected for mapping; these were assigned to DNA, to two distinct proteins, fatty acid, heme, and sucrose (cyroprotectant medium). B: Optical image of the section following hematoxylin and eosin staining after Raman analysis of the same area. C: Monochrome Raman map of the DNA signal, allowing more sensitive detection of the DNA signals.