![]() Figure 4 of
Beattie, Mol Vis 2007;
13:1106-1113.
Figure 4 of
Beattie, Mol Vis 2007;
13:1106-1113.
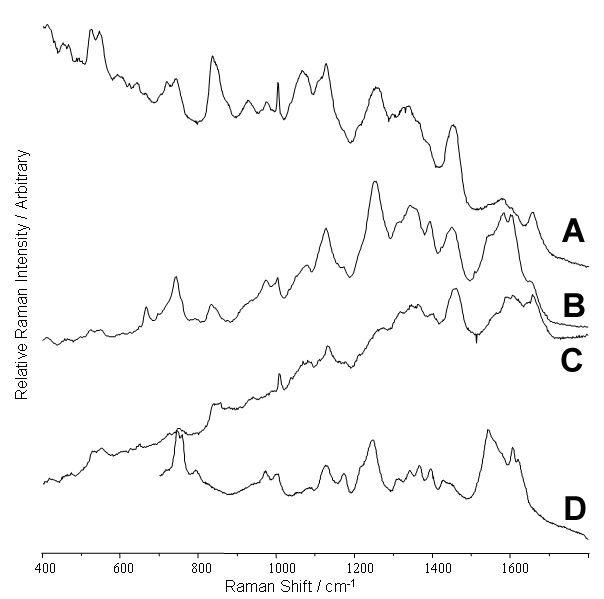
Figure 4. Raman spectra of the blood vessels
The spectra were acquired using (A) 785 nm, (B) 633 nm. and (C) 514 nm excitation. D: Raman spectrum of clotted porcine blood. The positions of the various bands within the retina display features at positions matching those of the clotted blood, although the relative intensities are probably altered, due to a difference in oxidation state.
