![]() Figure 3 of
Beattie, Mol Vis 2007;
13:1106-1113.
Figure 3 of
Beattie, Mol Vis 2007;
13:1106-1113.
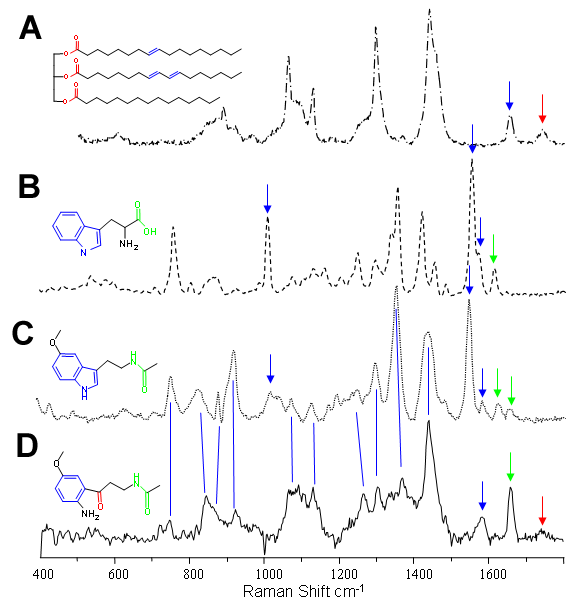
Figure 3. Inner plexiform layer signal compared with reference compounds
All spectra were recorded using 633 nm excitation. Raman spectra of (A) a typical triglyceride (porcine adipose), (B) tryptophan, and (C) melatonin are compared with (D) spectral signal found in ganglion cell layer. The spectrum in D is a scaled spectral subtraction of the ganglion cell layer signal from that of the inner plexiform layer. The subtraction was scaled to preclude negative bands; all common spectral features were removed. Additionally, color highlights, marking the chemical structures of the compounds with specific chemical bonds, correspond to colored arrows, indicating the region where spectral features appear. These, in turn, correspond to vibrational normal modes involving these bonds; blue (aromatic/olefinic), green (amide) and red (carbonyl). The scaled subtraction spectrum exhibits many bands in common with those in the reference spectra, but significant differences may tentatively be assigned to a combination of fatty acid and the oxidation product of melatonin, N1-acetyl-N5-methoxykynurenamine (structure shown).
