![]() Figure 5 of
Yang, Mol Vis 2007;
13:1073-1082.
Figure 5 of
Yang, Mol Vis 2007;
13:1073-1082.
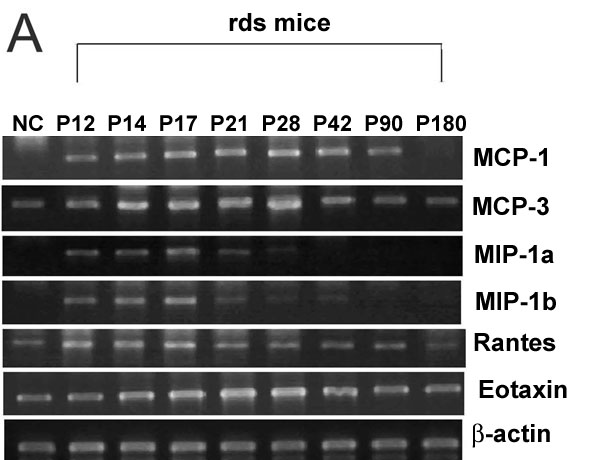
Figure 5. Retinal expression of chemokines in rds mice
A: The electrophoresis pattern of RT-PCR products for chemokines MCP-1, MCP-3, MIP-1β, MIP-1α, RANTES, and eotaxin in control and rds mice retinas. B: The time-course for chemokine mRNA expression in rds retina. The relative levels of mRNA were expressed as a ratio to that of β-actin. NC, P14 C3B mice. A p<0.01 (*) was considered significant compared with the normal control retina.