![]() Figure 3 of
Yang, Mol Vis 2007;
13:1073-1082.
Figure 3 of
Yang, Mol Vis 2007;
13:1073-1082.
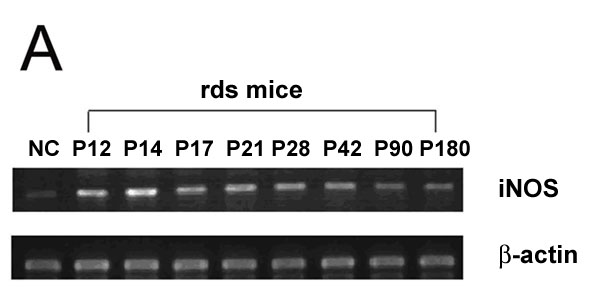
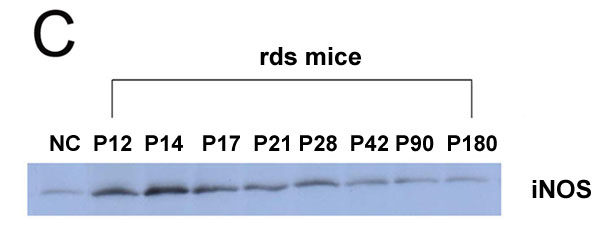
Figure 3. The iNOS mRNA and protein expression in control and rds mice retinas
A: Time course for iNOS mRNA expression in control and rds retinas for each age group. B: The relative levels of iNOS mRNA expression in rds mice were quantified and corrected for the level of β-actin mRNA expression. C: Time course for iNOS protein expression in control and rds retinas at each age group. D: The relative level of iNOS protein expression in rds mice were quantified and corrected for the levels of ERK2 protein expression. NC, P14 C3B mice. A p<0.01 (*) was considered significant compared with the normal control retina.