![]() Figure 3 of
Yao, Mol Vis 2007;
13:1066-1072.
Figure 3 of
Yao, Mol Vis 2007;
13:1066-1072.
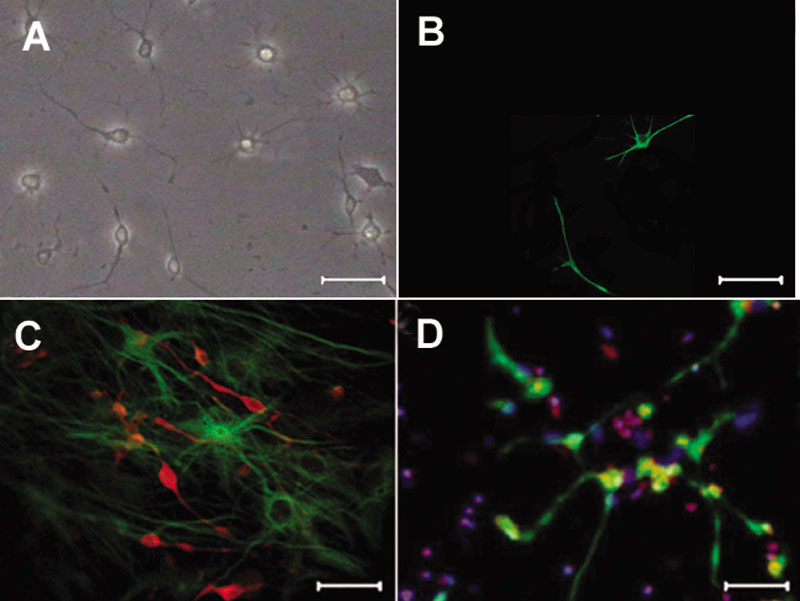
Figure 3. Retinal progenitor cells differentiation
A, B: The cells of group A were observed by phase-contrast microscopy (A) and fluorescence microscopy (B). Cells differentiated and spread processes 4 days after plating and green fluorescence was seen in the cytoplasm of some differentiated cells. C: A population of cells differentiated into Thy1.1 (red)- and GS (green)-immunopositive cells 2 weeks after plating. D: A population of RPCs differentiated into Thy1.1 (green)-immunopositive cells and a population of cells were still expressed BrdU (red) 2 weeks after plating, Hoechst (blue). Scale bars equal 75 μm.