![]() Figure 2 of
Yao, Mol Vis 2007;
13:1066-1072.
Figure 2 of
Yao, Mol Vis 2007;
13:1066-1072.
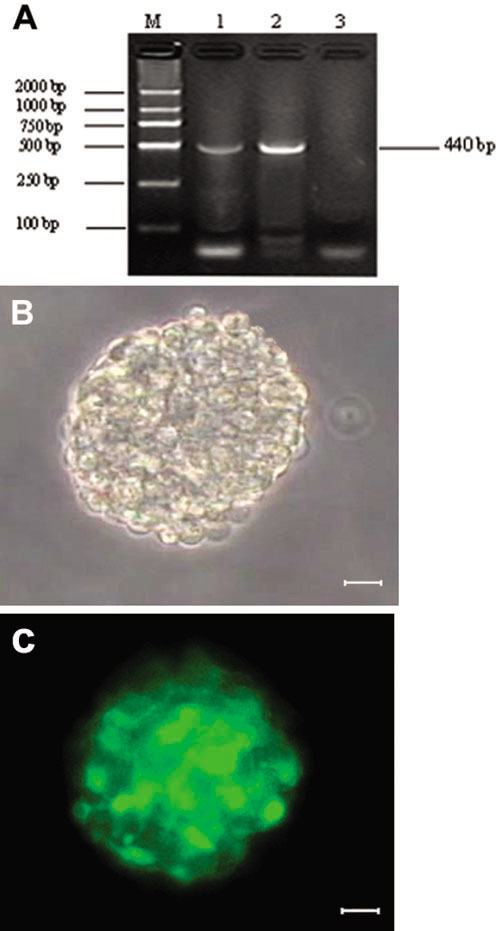
Figure 2. Cell transfection
A: RT-PCR product from cells transfected by pIRES2-EGFP-Math5 was 440 bp. The row is labeled as follows: M (DL2000 DNA Marker); 1 (cells transfected by pIRES2-EGFP-Math5); 2 (positive control); and 3 (negative control). B, C: The same neurosphere was seen by phase-contrast microscopy (B) and fluorescence microscopy (C). A subset of cells expressed green fluorescence 48 h after transfection. Scale bars equal 150 μm.