![]() Figure 4 of
Gu, Mol Vis 2007;
13:1045-1057.
Figure 4 of
Gu, Mol Vis 2007;
13:1045-1057.
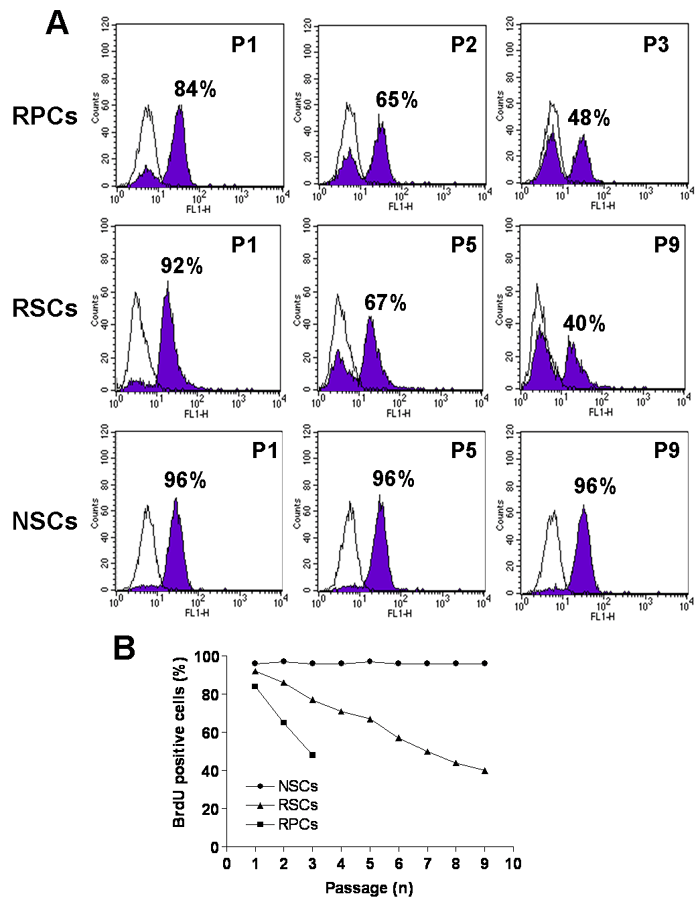
Figure 4. BrdU incorporation of retinal progenitor cell, retinal stem cell, and neural stem cell spheres at different passages
A: 84% and 92% of cells within retinal progenitor cell (RPC) and retinal stem cell (RSC) spheres, respectively were positive for BrdU at P1. The proportion of BrdU-positive cells decreased with increasing passages to less than 50% at P3 for RPCs and P9 for RSCs. The proportion of BrdU-positive cells within brain NSC-spheres remained constant at around 96% from P1 to P9. For each plot the shaded profile shows counts of cells after BrdU labeling detected by FACS, the white profile represents counts of control cells reacted with secondary antibody only. Individual values at each passage are plotted in B.
