![]() Figure 1 of
Ando, Mol Vis 2007;
13:1038-1044.
Figure 1 of
Ando, Mol Vis 2007;
13:1038-1044.
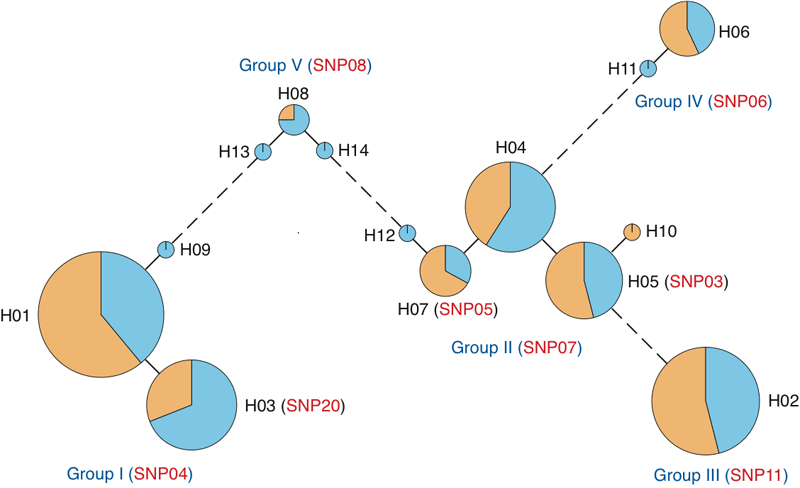
Figure 1. Phylogeny of Japanese rhodopsin gene haplotypes
The area of the circle is proportional to the frequency of each haplotype. The ratio of RP patients (orange) and controls (light blue) for each haplotype is color-coded. The number of line segments between circles corresponds to the number of nucleotide substitutions between haplotypes. The RHO haplotypes can be classified into five groups designated as Group I to Group V. The haplotype-tagging SNP (htSNP) distinguishing each group is described in the parentheses following the group name and the haplotype name.
