![]() Figure 2 of
Kamphuis, Mol Vis 2007;
13:1020-1030.
Figure 2 of
Kamphuis, Mol Vis 2007;
13:1020-1030.
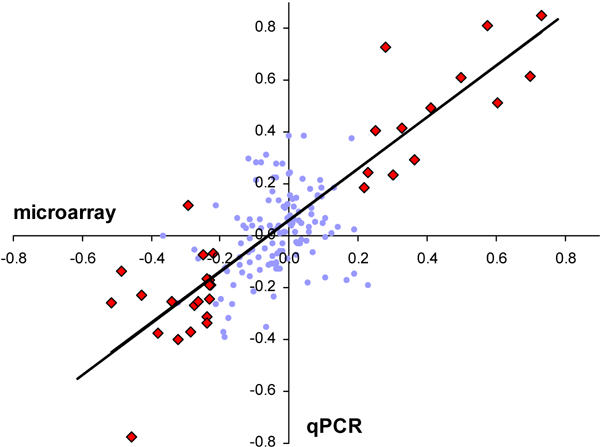
Figure 2. Linear regression between microarray and qPCR results both expressed as log10 fold-change for different experimental groups with reference to the levels in controls
Each of the 161 data point shown represents the average of five or six animals; R2=0.54, y=0.85+0.04 (blue dots and red diamonds). The trend line shown is based on the subset of microarray data points meeting the selection criteria (>1.7 fold and p<0.01; n=34) related to 21 different genes-of-interest; R2=0.85, y=0.99+0.06 (red diamond symbol).
