![]() Figure 4 of
Jiang, Mol Vis 2007;
13:968-974.
Figure 4 of
Jiang, Mol Vis 2007;
13:968-974.
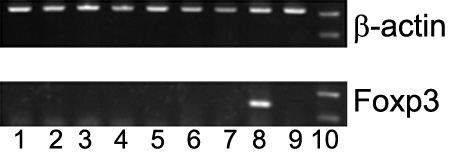
Figure 4. Reverse transcription-PCR analysis of Foxp3 expression in CD8+ T cells from normal mice, anterior chamber-associated immune deviation mice, and phosphate-buffered saline-anterior chamber-injected mice without stimulation or with specific or nonspecific stimulation
As a control, β-actin was amplified from the same RNA sample. Lane 1: normal mice without stimulation; lane 2: ACAID mice without stimulation; lane 3: PBS-AC-injected mice without stimulation; lane 4: normal mice stimulated with OVA; lane 5: ACAID mice stimulated with OVA; lane 6: PBS-AC-injected mice stimulated with OVA; lane 7: normal mice stimulated with anti-CD3 plus anti-CD28; lane 8: ACAID mice stimulated with anti-CD3 plus anti-CD28; lane 9: PBS-AC-injected mice stimulated with anti-CD3 plus anti-CD28; lane 10: DNA marker. Results are representative of two independent experiments.