![]() Figure 3 of
Jiang, Mol Vis 2007;
13:968-974.
Figure 3 of
Jiang, Mol Vis 2007;
13:968-974.
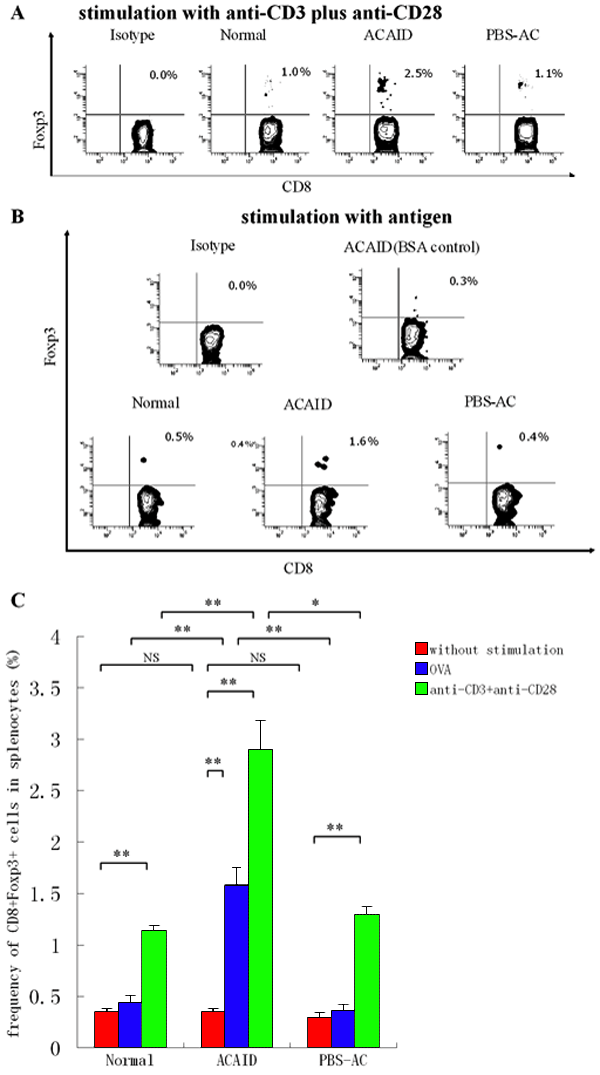
Figure 3. Flow cytometry analysis of Foxp3 protein expression in CD8+ T cells from normal mice, anterior chamber-associated immune deviation mice, and phosphate-buffered saline-anterior chamber-injected mice without stimulation or with specific or nonspecific stimulation
Whole spleen cells were obtained from C57BL/6 mice 14 days after anterior chamber (AC) injection. Intracellular staining of Foxp3 is shown in gated CD8+ cells from anterior chamber-associated immune deviation (ACAID) mice, phosphate-buffered saline-anterior chamber (PBS-AC)-injected mice and normal mice. In the ACAID group, the mice received an AC injection of 5 μl ovalbumin (OVA; 20 mg/ml). PBS-AC-injected mice received an AC injection of 5 μl PBS. A: Representative data showing the expression of Foxp3 on CD8+ splenocytes from normal, ACAID, and PBS-AC-injected mice following polyclonal stimulation. B: Representative data showing the expression of Foxp3 on CD8+ splenocytes from normal, ACAID, and PBS-AC-injected mice after stimulation with OVA or BSA control. C: The statistic histogram for the frequencies of CD8+Foxp3+ cells in different groups with or without stimulation. Results represent the mean±SEM of two separate experiments. The double asterisk indicates a p<0.01, and NS denotes a p>0.05.
