![]() Figure 4 of
Qi, Mol Vis 2007;
13:1-11.
Figure 4 of
Qi, Mol Vis 2007;
13:1-11.
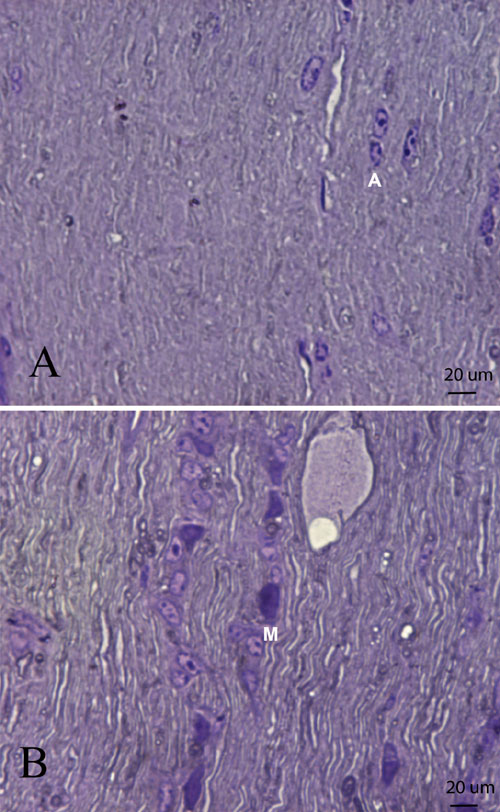
Figure 4. Suppression of cellular infiltration
Representative light micrographs show that cellular infiltration in the retrobulbar optic nerve is reduced by double protection with ECSOD and catalase (A) relative to the unprotected optic nerve (B). The barplot shows the mean optic nerve cell count of the retrobulbar optic nerve protected by both ECSOD and catalase (ECSOD OD), catalase (Wt OD), ECSOD (ECSOD OS) and unprotected EAE (Wt OS; C). Barplot (D) illustrates the reduction in the optic nerve cell count induced by both ECSOD and catalase, catalase or ECSOD relative to unprotected nerves. Asterisk (*) represents p<0.05 double asterisks (**) represents p<0.01, A represents astrocyte, M represents mononuclear inflammatory cell.