![]() Figure 3 of
Qi, Mol Vis 2007;
13:1-11.
Figure 3 of
Qi, Mol Vis 2007;
13:1-11.
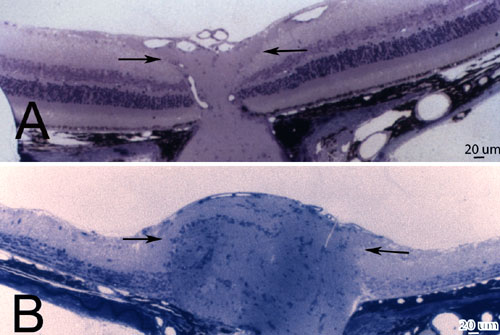
Figure 3. Suppression of optic disc swelling
Representative light micrographs showing catalase and SOD suppressed optic nerve head edema (A) relative to the unprotected optic nerve (arrows) exhibiting marked swelling of the optic nerve head (B). The barplot of mean optic nerve head (ONH) areas shows that optic nerve head swelling (smaller ONH area) was reduced by combined ECSOD and catalase (ECSOD OD) treatment, catalase treatment (Wt OD), ECSOD treatment (ECSOD OS), but it was greatest with no treatment (Wt OS; C). Barplot (D) illustrates the reduction in ONH swelling induced by ECSOD and catalase, catalase or ECSOD relative to unprotected nerves. Asterisk (*) represents p<0.05, double asterisks (**) represents p<0.01.