![]() Figure 3 of
Nakazawa, Mol Vis 2006;
12:867-878.
Figure 3 of
Nakazawa, Mol Vis 2006;
12:867-878.
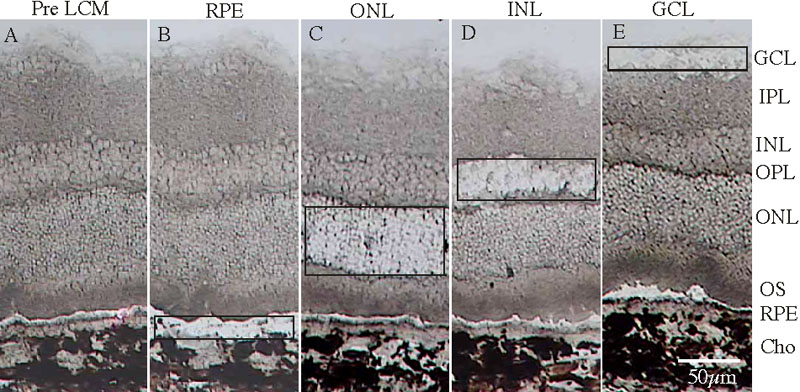
Figure 3. Expressional changes of cytokines in individual retinal layers: laser capture microdissection
A-E: Representative photomicrographs of retinal sections taken before (A) and after LCM (B-E). Black rectangle indicates the retinal layer where LCM was performed. F: Quantitative analysis of RNA samples obtained by LCM with QPCR to determine levels of bFGF, TNF-α, IL-1β, and MCP-1 mRNAs in different layers of the retina (n=6). The ganglion cell layer (GCL), inner plexiform layer (IPL), inner nuclear layer (INL), outer plexiform layer (OPL), outer nuclear layer (ONL), outer segment (OS), retinal pigment epithelium (RPE), and choroid (Cho) are identified. Asterisks (*) indicate significant difference (p<0.05) compared to control eyes.