![]() Figure 2 of
Nakazawa, Mol Vis 2006;
12:867-878.
Figure 2 of
Nakazawa, Mol Vis 2006;
12:867-878.
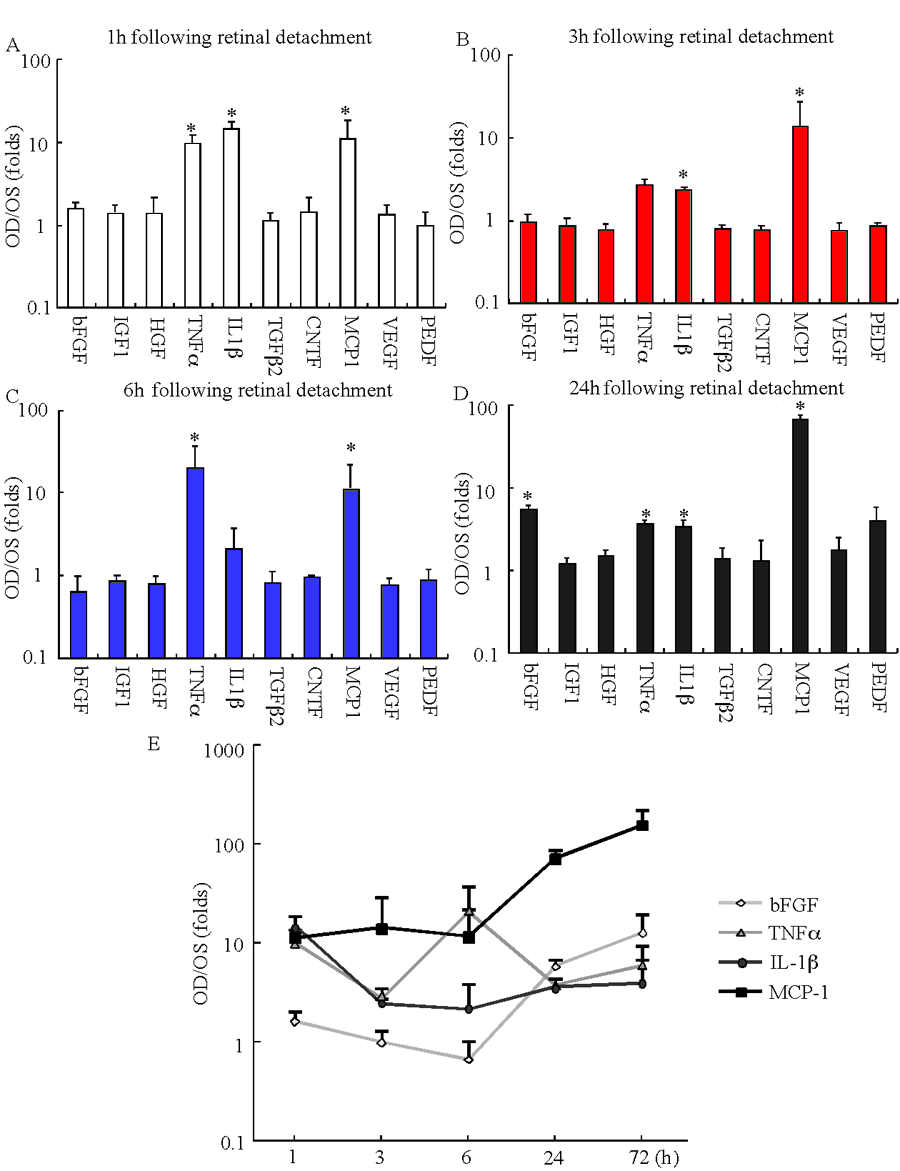
Figure 2. Time course study of cytokine induction after retinal detachment
A-D: Quantification by QPCR of RD-induced expression of various cytokines at 1 (A), 3 (B), 6 (C), and 24 h (D) after RD (n=6). Note that the mRNA levels of TNF-α, IL-1β, and MCP-1 were significantly increased at 1 h after RD, while the induction of bFGF was not detected until 24 h. E: Summary of time course studies for the induction of bFGF, TNF-α, IL-1β, and MCP-1 after RD. Asterisks (*) indicate significant difference (p<0.05) compared to control eyes.
