![]() Figure 1 of
Nakazawa, Mol Vis 2006;
12:867-878.
Figure 1 of
Nakazawa, Mol Vis 2006;
12:867-878.
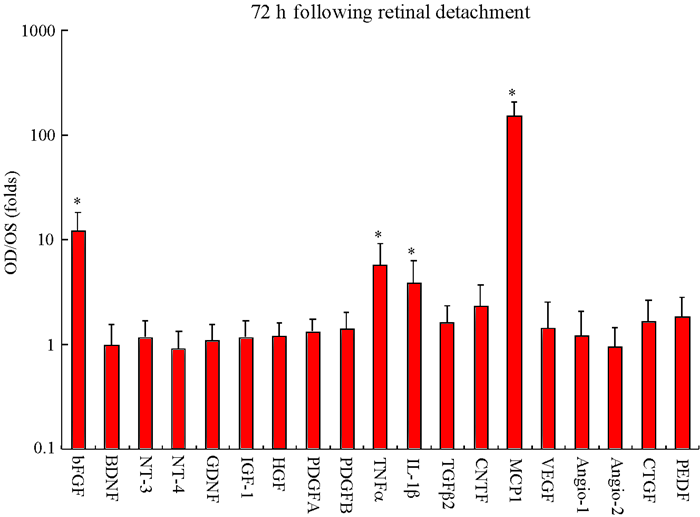
Figure 1. Changes in growth factor and cytokine expression in neural retina after retinal detachment
Quantitative analysis (these data are from 6 different eyes) of the induction of growth factor and cytokine mRNAs by QPCR at 72 h after RD. Y-axis represents the ratio of mRNA expression in the experimentally detached retina of the right eye (OD) to that of the control left eye (OS). bFGF represents basic fibroblast growth factor; BDNF represents brain represents derived neurotrophic factor; NT-3 represents neurotrophin-3; NT-4 represents neurotrophin-4; GDNF represents glial cell line-derived neurotrophic factor; IGF-1 represents insulin-like growth factor-1; HGF represents hepatocyte growth factor; PDGFA and PDGFB represent platelet-derived growth factors A and B; TNF-α represents tumor necrosis factor-α; IL-1β represents interleukin-1β; TGF-β2 represents transforming growth factor β 2; CNTF represents ciliary neurotrophic factor; MCP-1 represents monocyte chamoattractant protein-1; VEGF represents vascular endothelial growth factor; Angio-1 and Angio-2 represents angiopoietin-1 and angiopoietin-2; CTGF represents connective tissue growth factor; PEDF represents pigment epithelium-derived factor. Asterisks (*) indicate significant difference (p<0.05) compared to control eyes.
